
MY ROLE : UX Researcher & UX Designer
TIMEFRAME: August, 2018 - November, 2018
CLASS: HCI Research Methods, Sponsored by Focus Brands
TEAM STYLE: 4 UX Researchers & UX Designers
TEAMMATES: Komal Hirani, Alana Pendleton, Rex McKay
TOOLS USED: Stakeholder Analysis, Benchmarking, Observational Studies, Interviews, Affinity Mapping, Optimal Workshop, Value Propositions, Persona Generation, Tab Through Analysis, Visual Impairment Simulator, Journey Maps, User Testing, Adobe XD, Heuristic Analysis, Data Analysis, and PowerPoint
BIGGEST TAKEAWAY: Research driven design choices are a must when it comes to accessibility.
Focus Brands | E-Commerce Redesign for Accessibility
Objective
Over one semester: To improve and redesign Focus Brands’ e-commerce experience to be more accessible for a wider range of audience, and to create a more pleasant and efficient experience
Our Given Problem
“Customers order online on a multitude of devices. How should Focus Brands design a best in-class ordering platform that can be used by a wide range of customers?”
– Focus Brands
Target Audience
Schlotzsky’s provided the Fast Track Couples & Generational Soup Personas among others. We limited down to these personas as they were the people who were ordering online in addition to going in-store.
Having known that we were redesigning a site to more accessible, we generated target audience personas to begin the project. The information was gathered from Schlotzsky’s persona information and paired with the Web Content Accessibility Guidelines (WCAG). We walked through each persona with a value proposition template to best understand what each person would prioritize in their online ordering experience. This start also helped to recruit for our interviews.
Additionally, Rex and I went in-store to evaluate the branding of Schlotszky’s and how they were treating their customers, and discovered their food was also tasty in the process.
Interviews & Affinity Mapping

The team and I working through the affinity mapping.
Since we had background information on sighted users from Focus Brands, the team focused on visually-impaired users. We interviewed two individuals in-depth about their online ordering experiences and gathered the information in the form of affinity mapping. One individual has color-blind vision, specifically red-green impairments; the other individual has no sighted vision at all. From the affinity mapping, we determined the main processes about which visually impaired users use to order food online, what technology is involved in that process, and also the struggles they endure throughout the process.

A summary of our findings from the affinity mapping.
While we did keep in mind every implication we found, we prioritized 3 implications in particular because of the emphasis and frequency at which they were founded:
Good filters and/or efficient navigation
“Personalized menu”
Detailed item descriptions
Rigorous Research Analysis
At this point, we wanted to breakdown the current experience for all users. We utilized 4 different methods to best analyze this: Tab-Through Analysis, Accessibility Filtering, Journey Maps, and Implications.
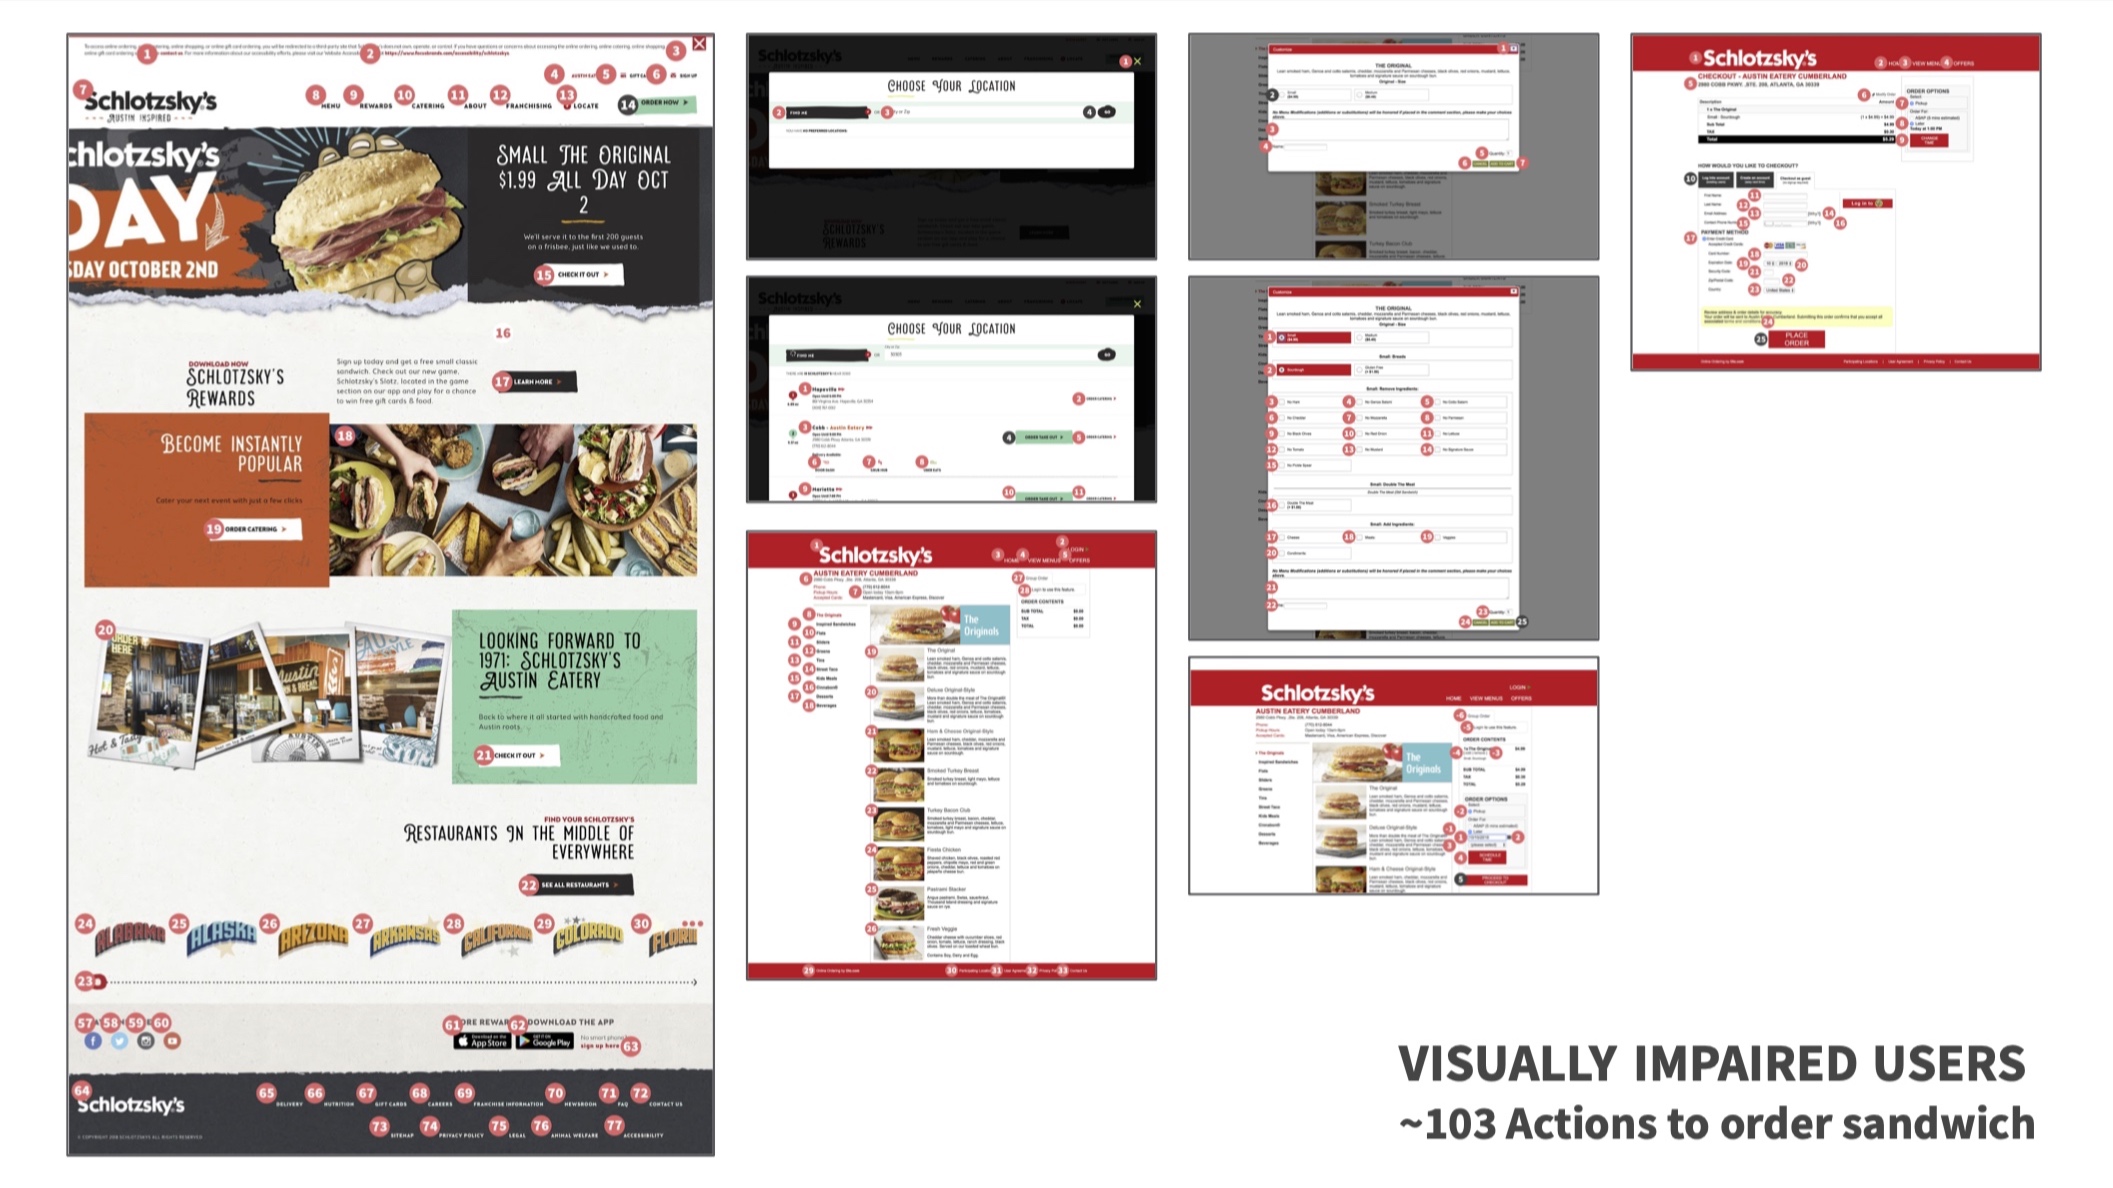
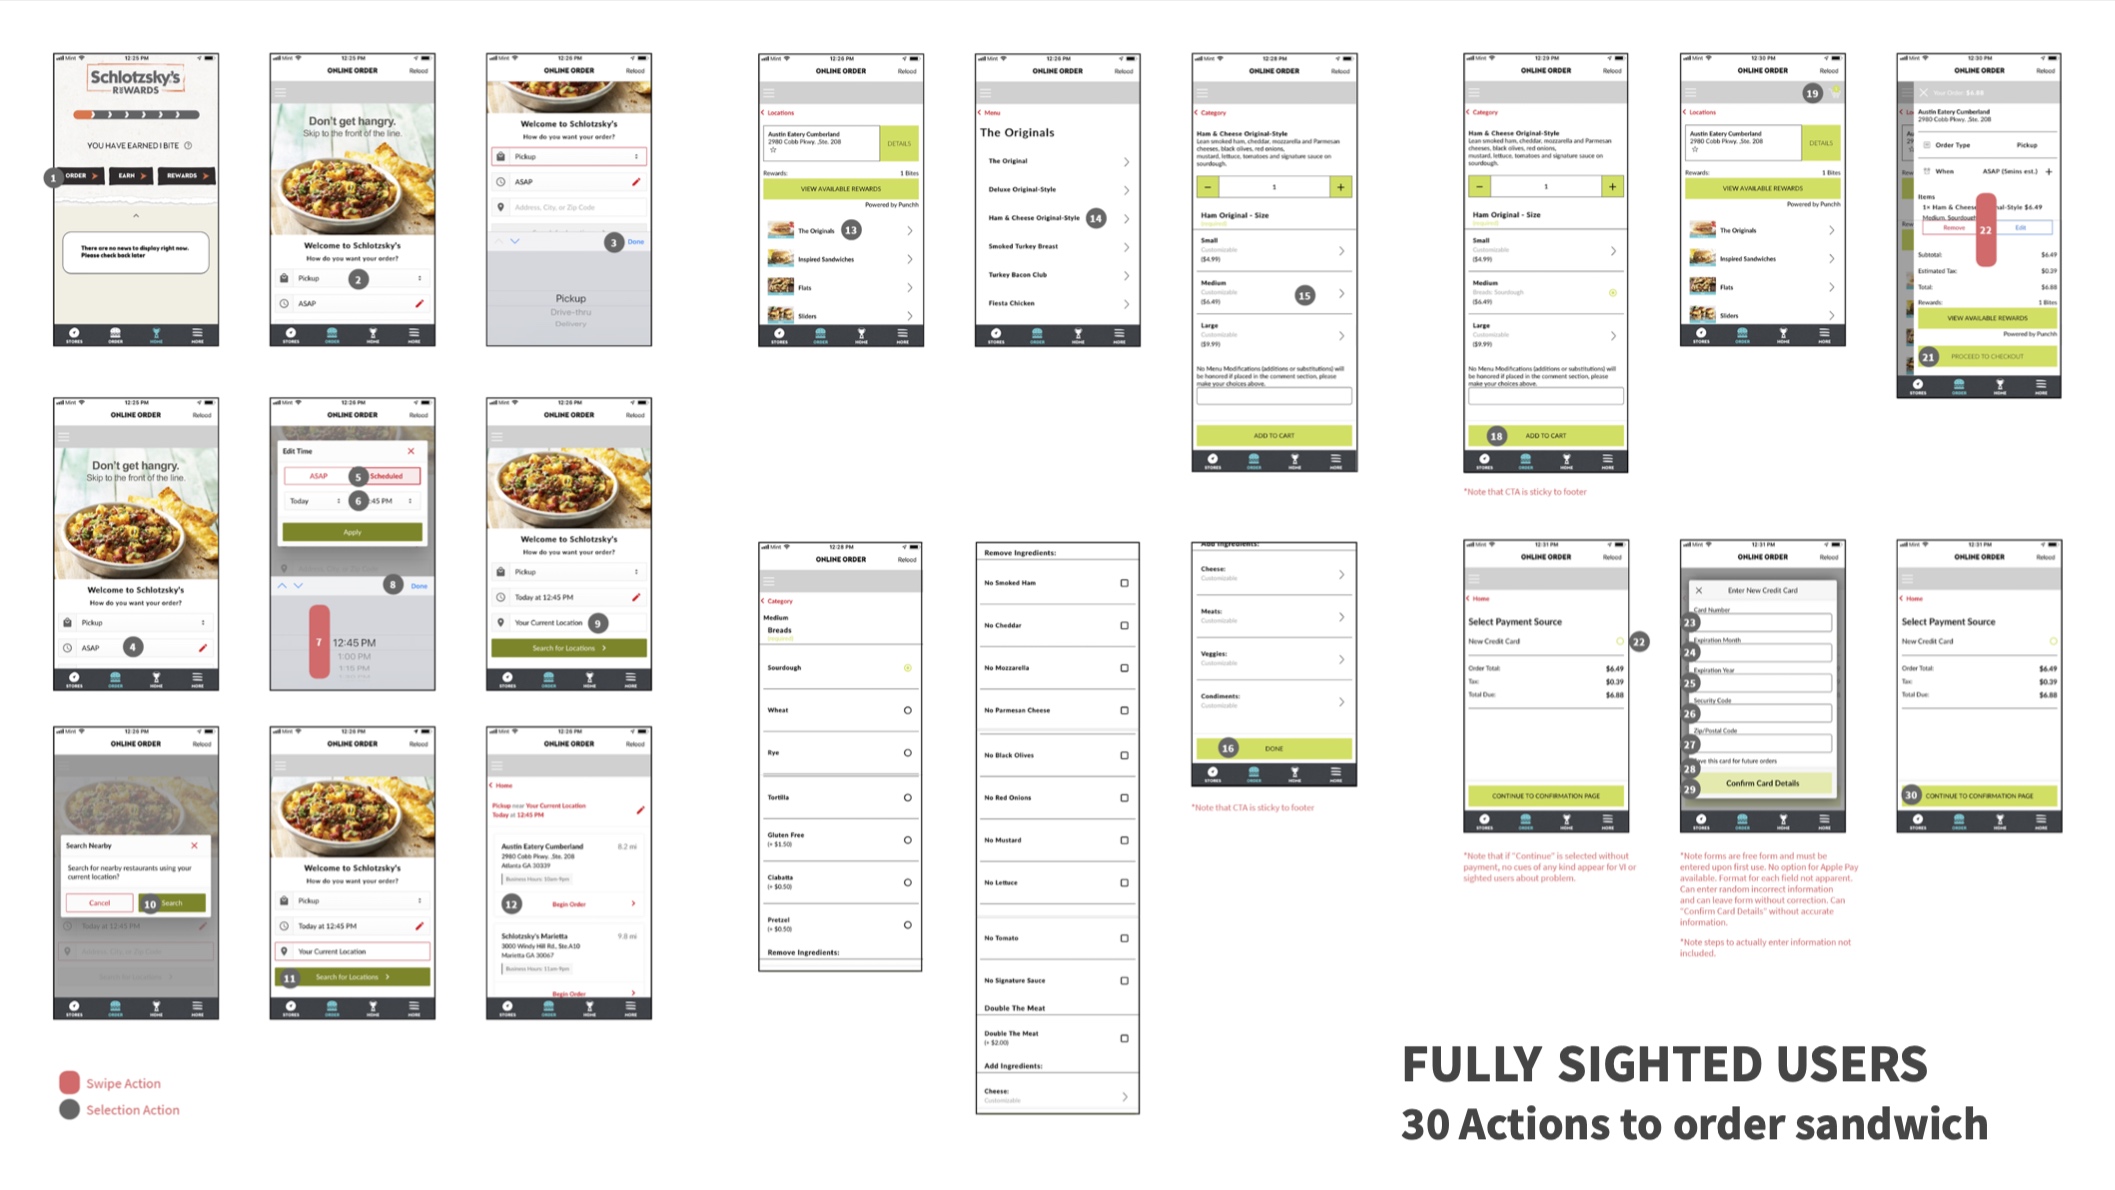
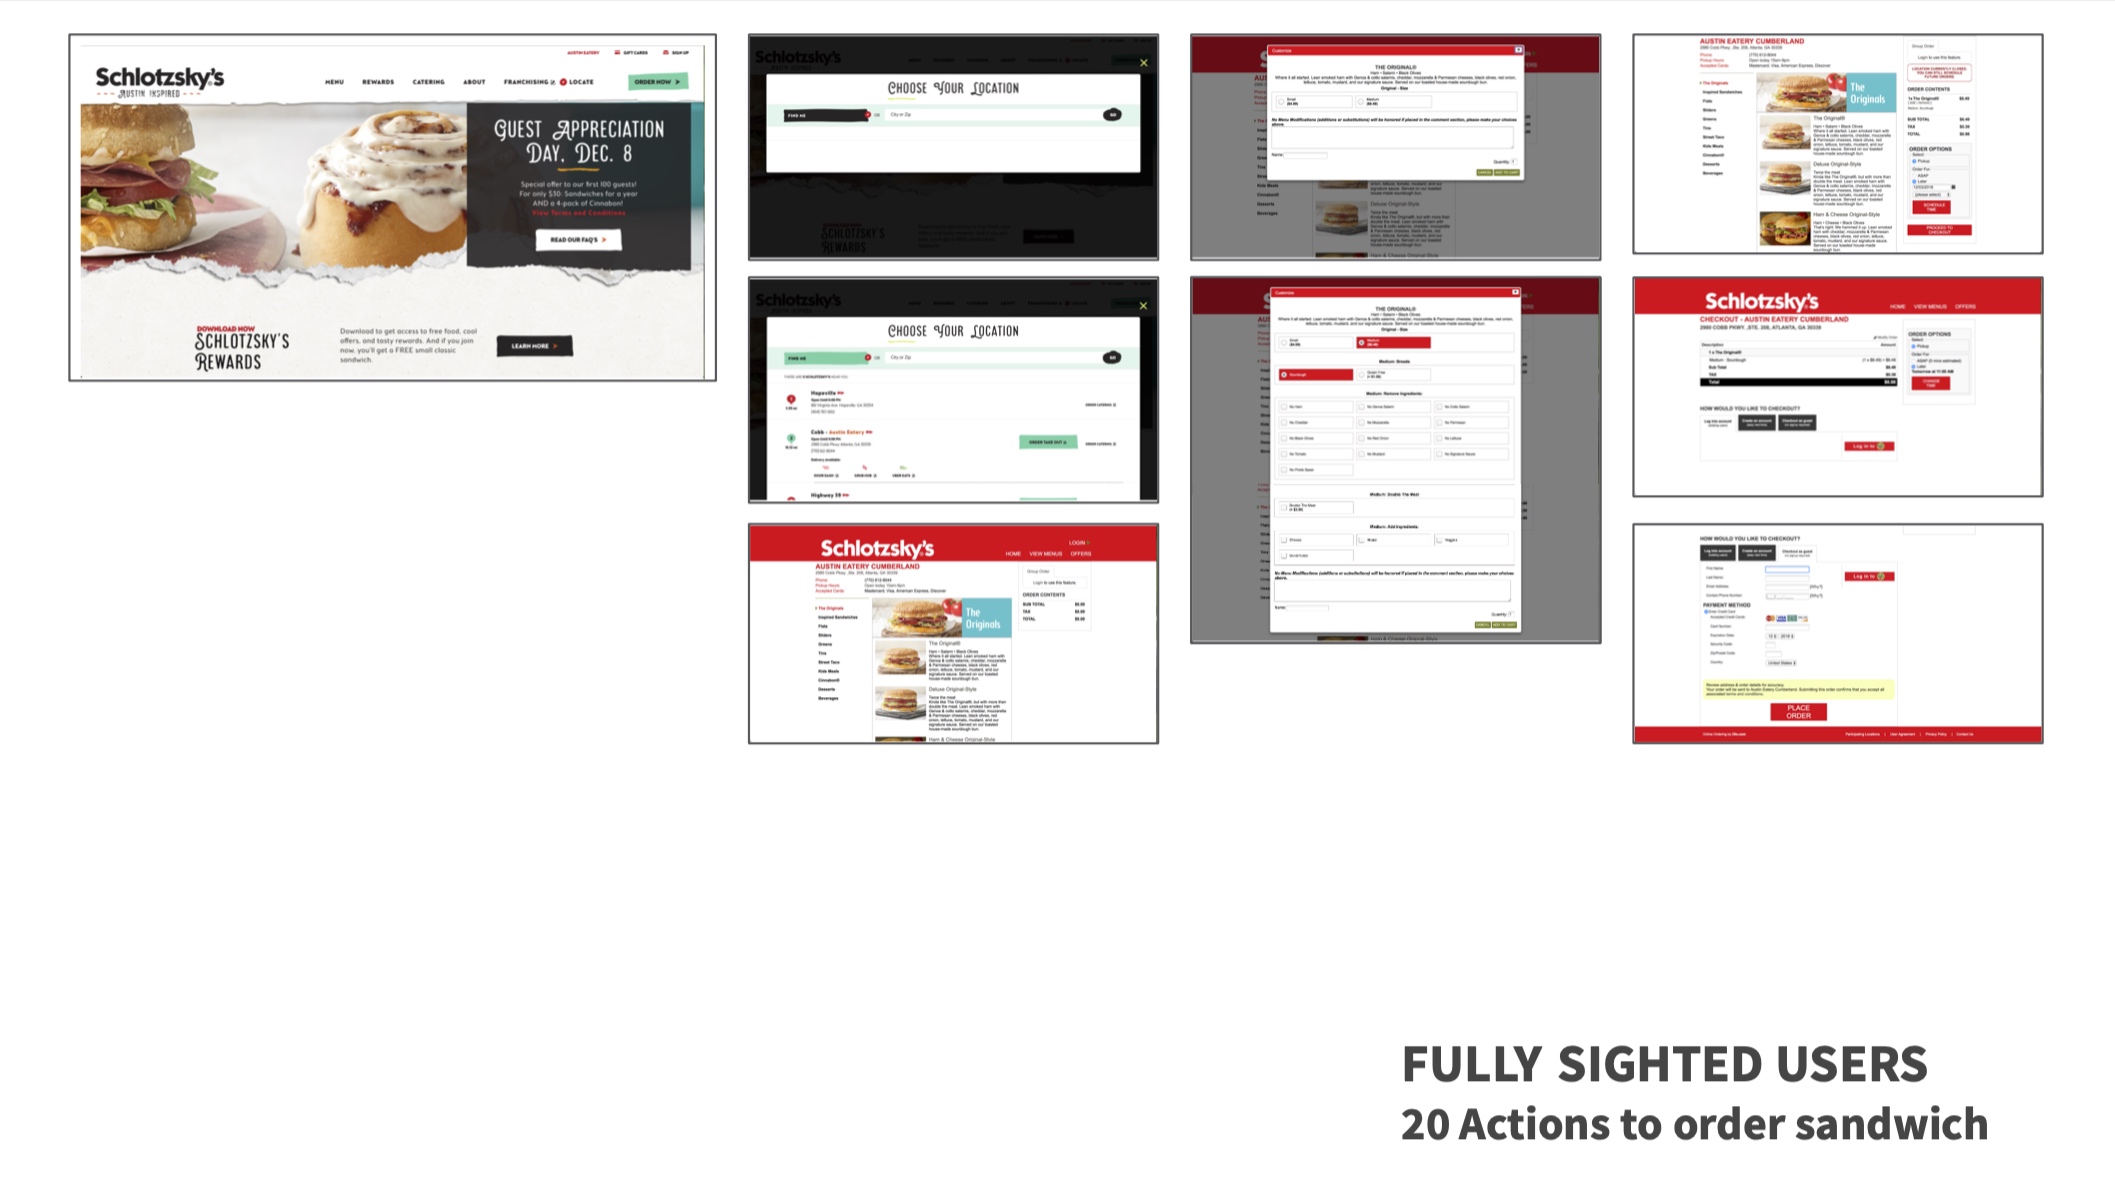
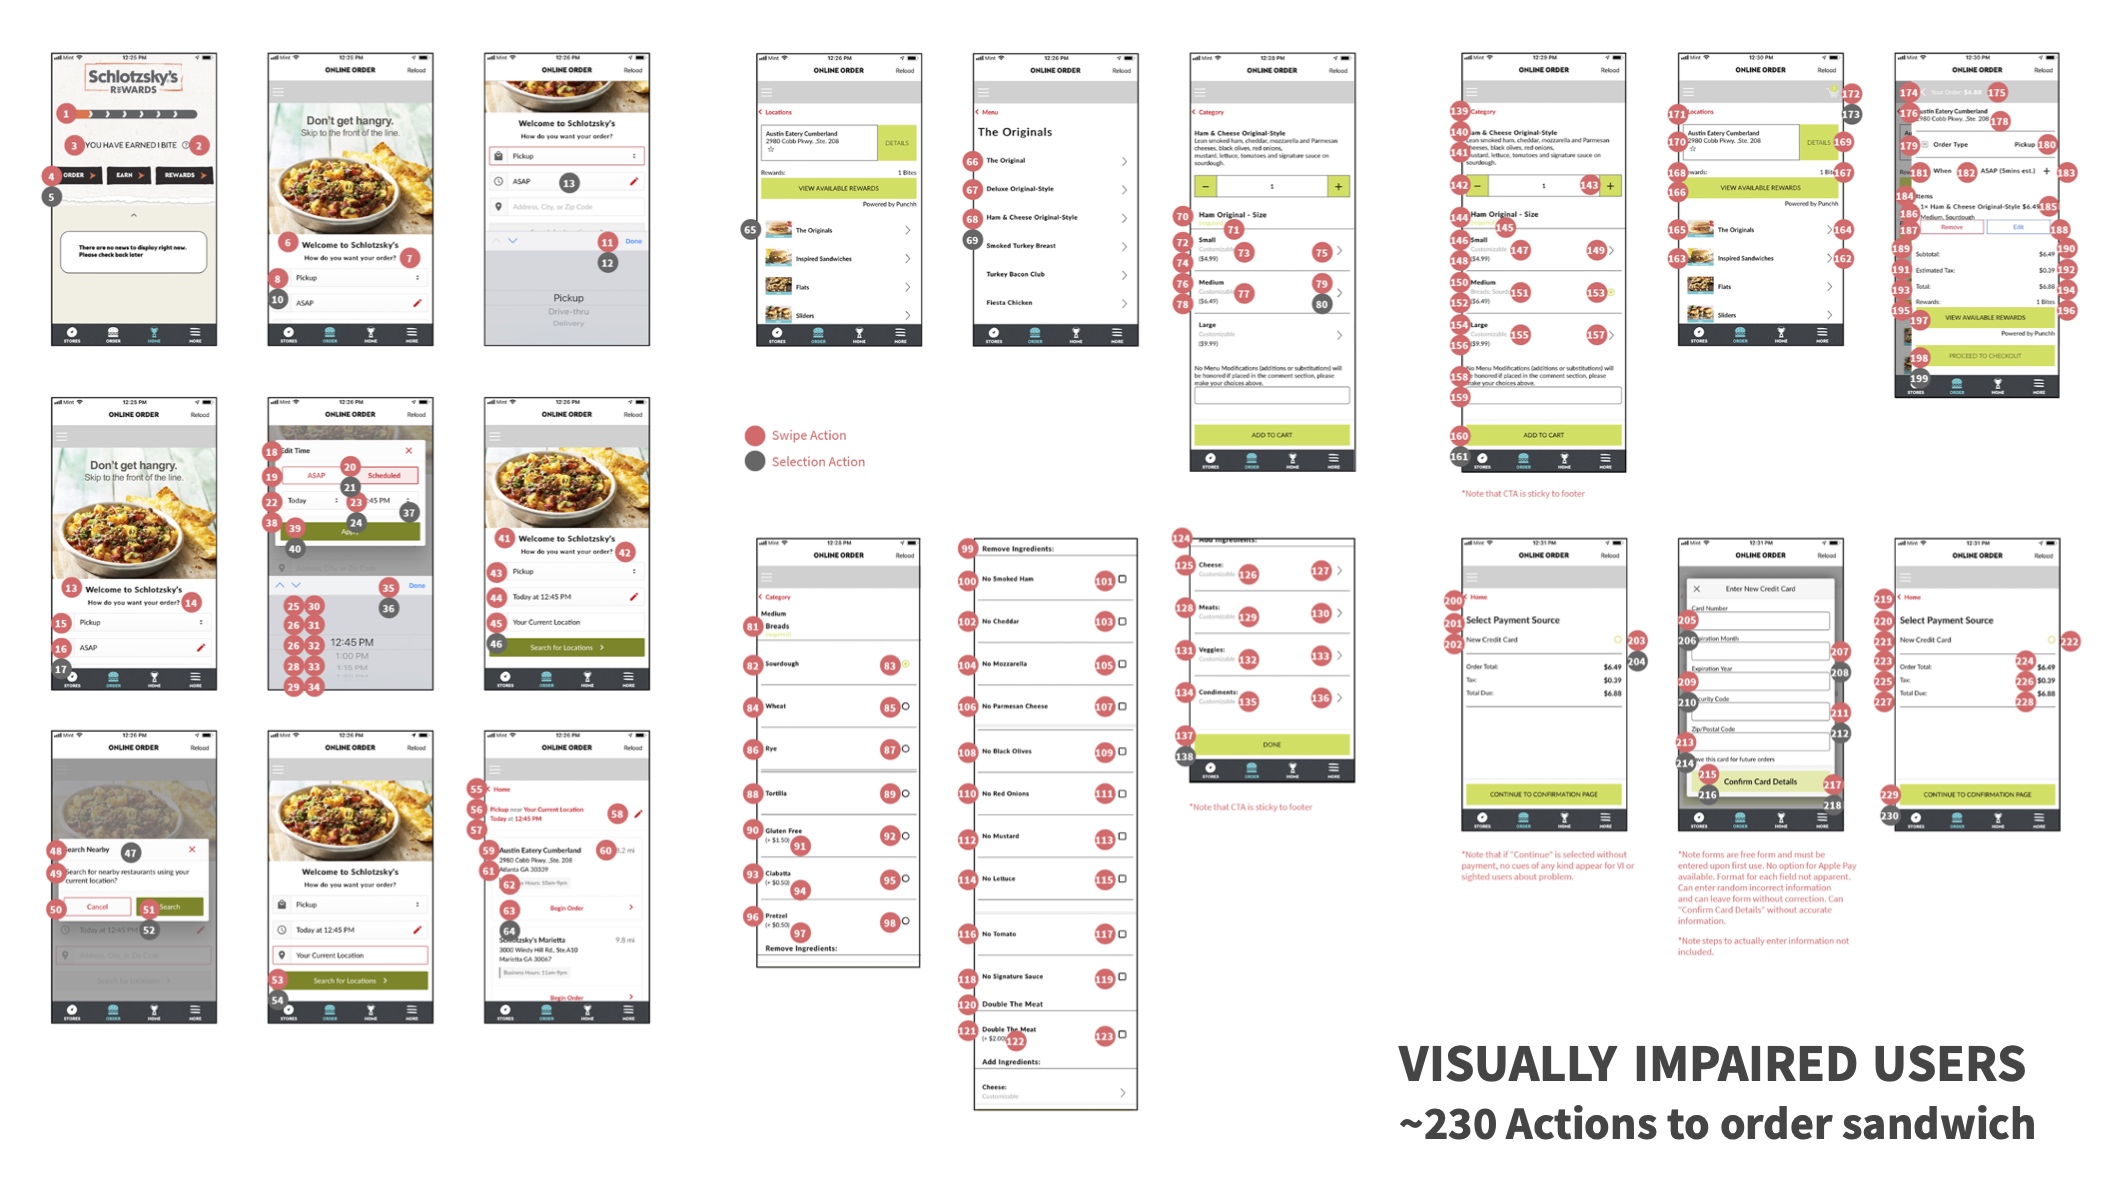
TAB-THROUGH ANALYSIS
My team and I actually generated this method ourselves. We wanted to know exactly how many “actions,” meaning number of tabs, steps, taps, etc., it would require to complete the online ordering process on Schlotzsky’s website and mobile application for sighted and visually-impaired users. In order to do tab-through for the visually-impaired users, the team enabled built-in accessibility features on our personal laptops and phones; we did this because our interviewed users utilize built-in settings currently. We then counted the number of inputs used during the ordering process. To say we were overwhelmed is an understatement. Here are our results:
ACCESSIBILITY FILTERING

What better way to understand how a person who is color blind or has contrast issues than to adjust your own screen to reflect that? The team was able to get a taste of another person’s life through a Chrome plug-in, Funkify. With it, we were able to understand the online ordering process, and generally the online experience through different impairments.
JOURNEY MAPS

At this point, we understood our audience better than ever: we had interview data, Focus Brands data, tabbing data, and visually impaired simulation data. Now we moved through their individual journeys, marking areas of opportunity. To start we generated the user flow. This would keep the journeys as consistent as possible, though we discovered some unique differences between sighted and especially fully blind journeys. Such one was how the fully blind were likely to restart their journey if they were to activate the deceiving “View Menu” option on the e-commerce site; this would actually resend them through the location-finding process, which they would have already completed at this point.
Opportunities were determined as periods of prolonged plateaus (positive or negative) and extreme dips into the negative.


IMPLICATIONS & GOALS
Here we summarized our design implications and defined what our goals would be during the redesign. These are not only for visually impaired users, but for all users to enjoy.
GOALS
Simplify Navigation Bar
Reduce Number of Tabs Used
Simplify Customization Process
Establish Consistency between Marketing and E-Commerce experience
Improve the Checkout process
IMPLICATIONS
Cluttered Navigation Bar
Causes High Number of Tabbing
Overwhelming Customization Process
Induces Excessively High Amount of Tabbing
Inconsistent Between Marketing and E-commerce Site
Users are Confused and Untrusting
Lack of Payment Options During Checkout Process
Requires More Text Input
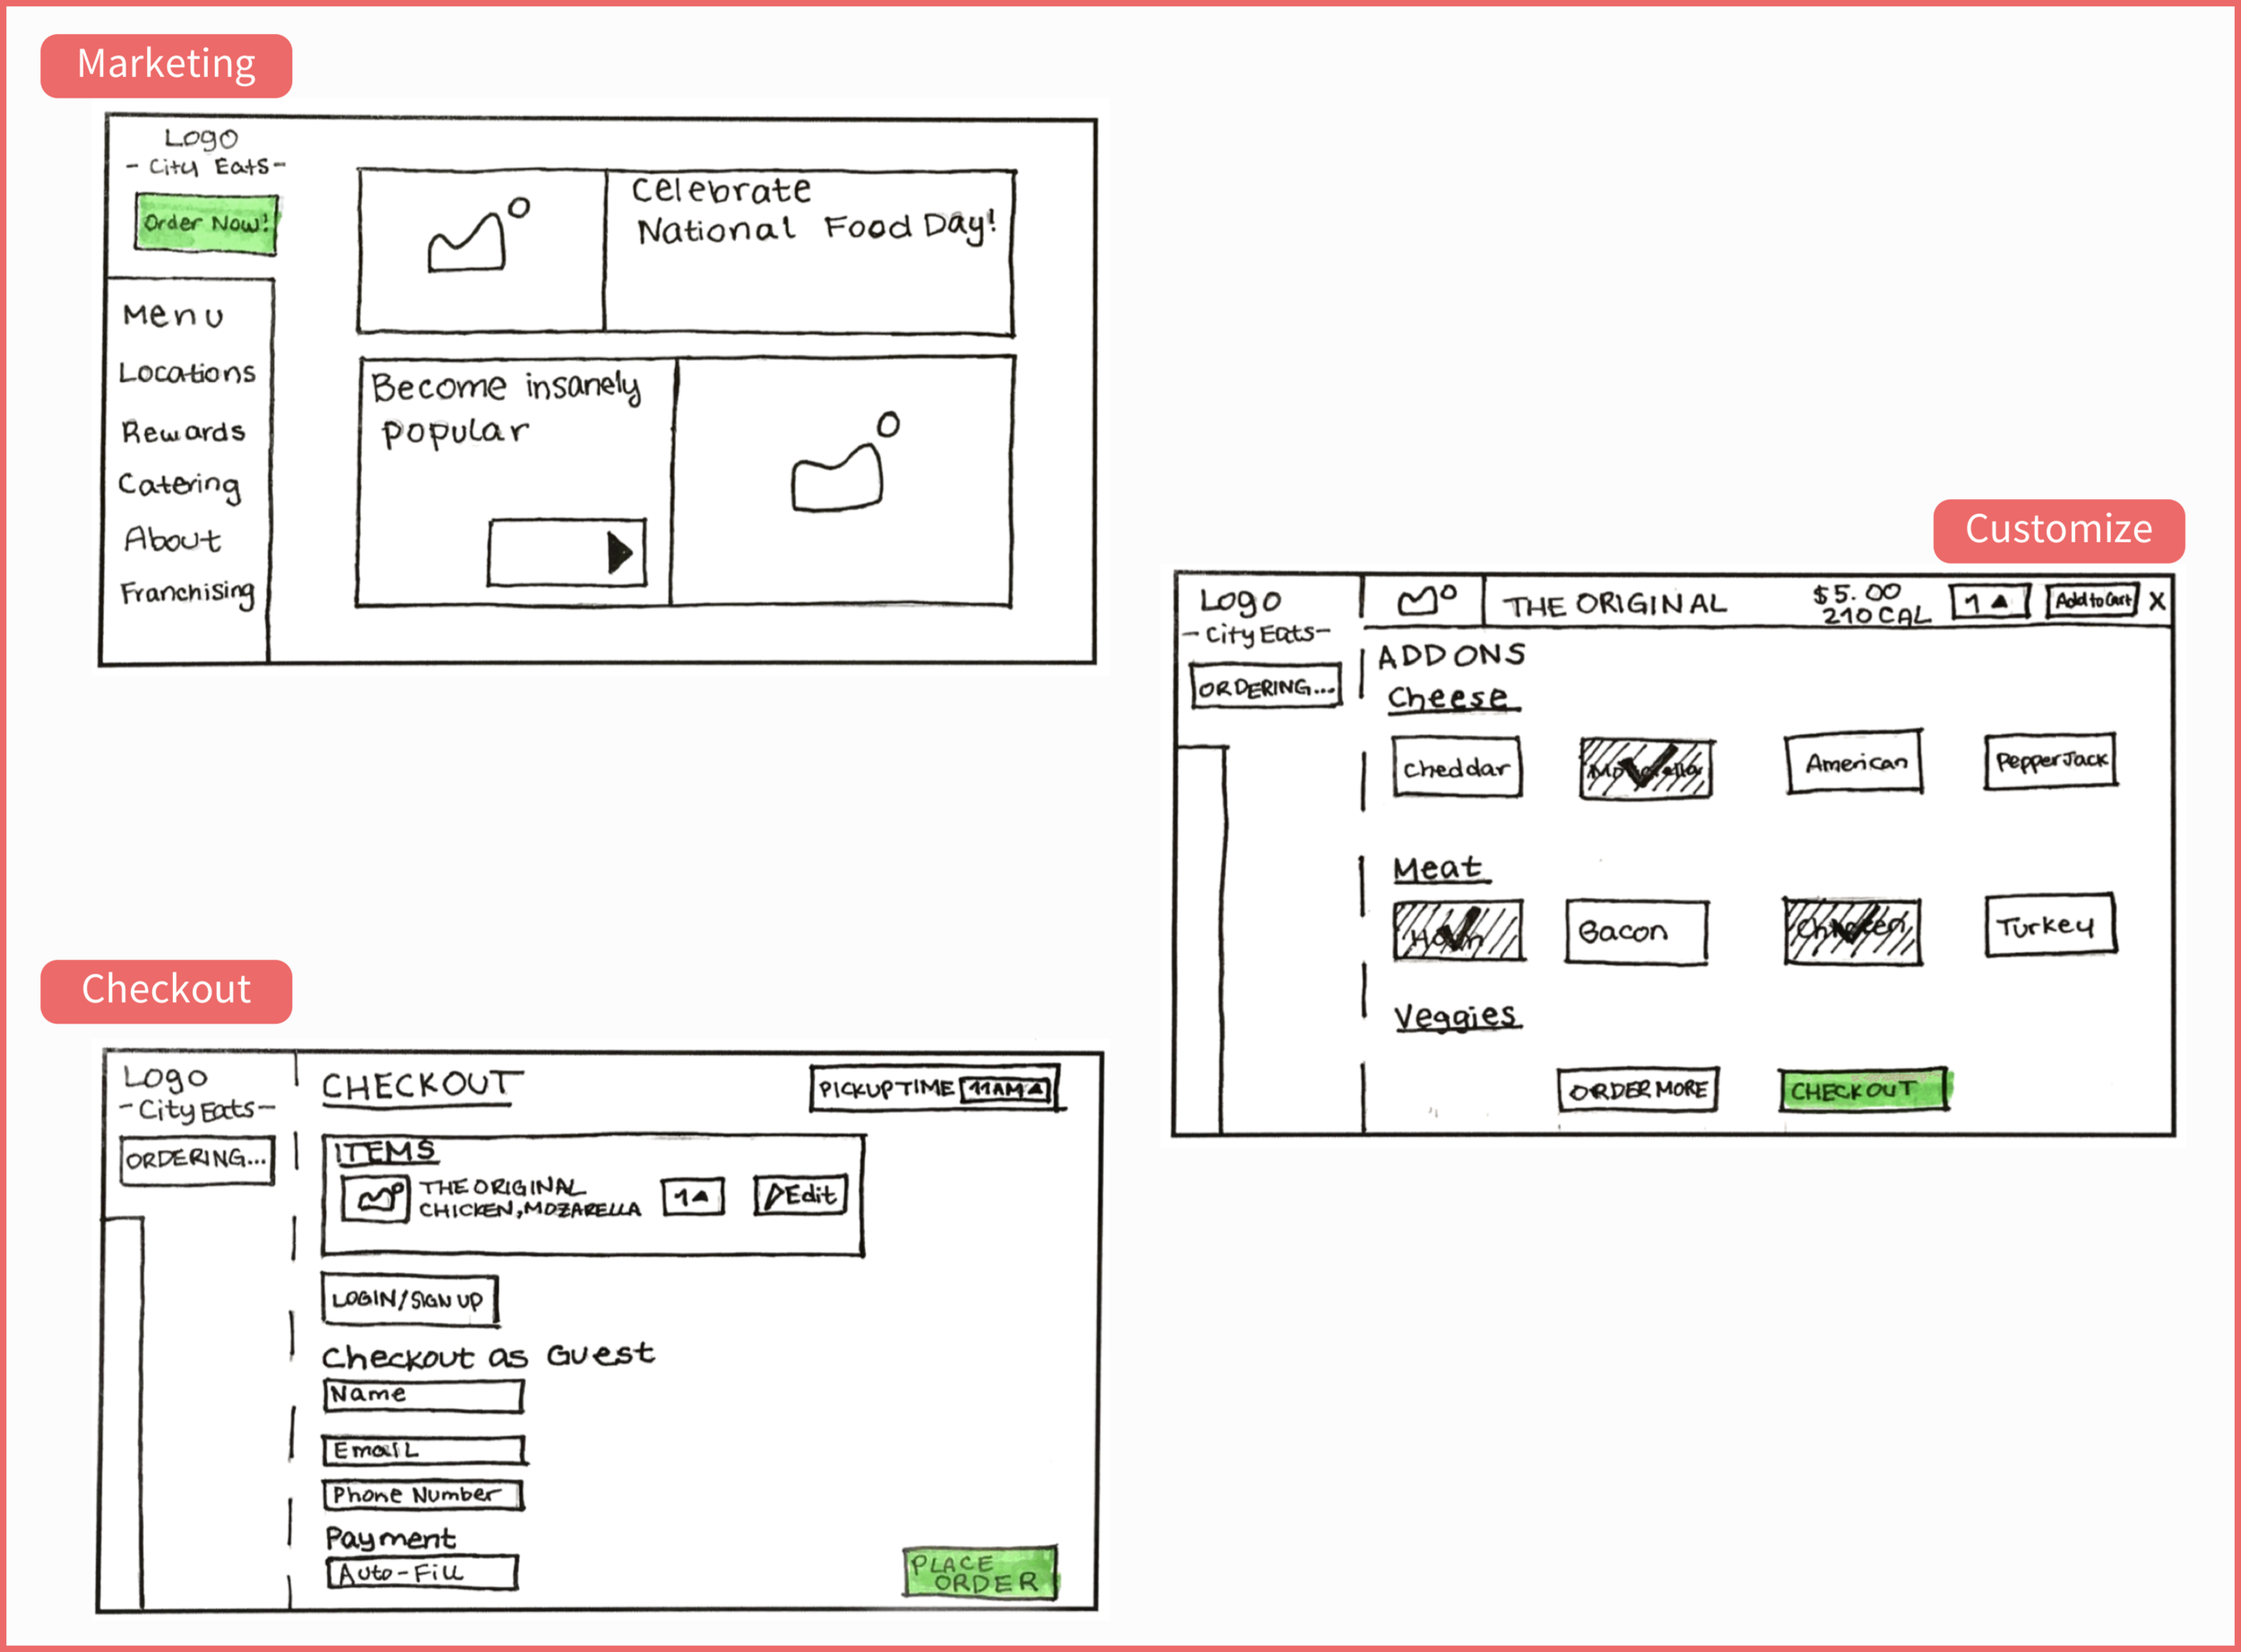
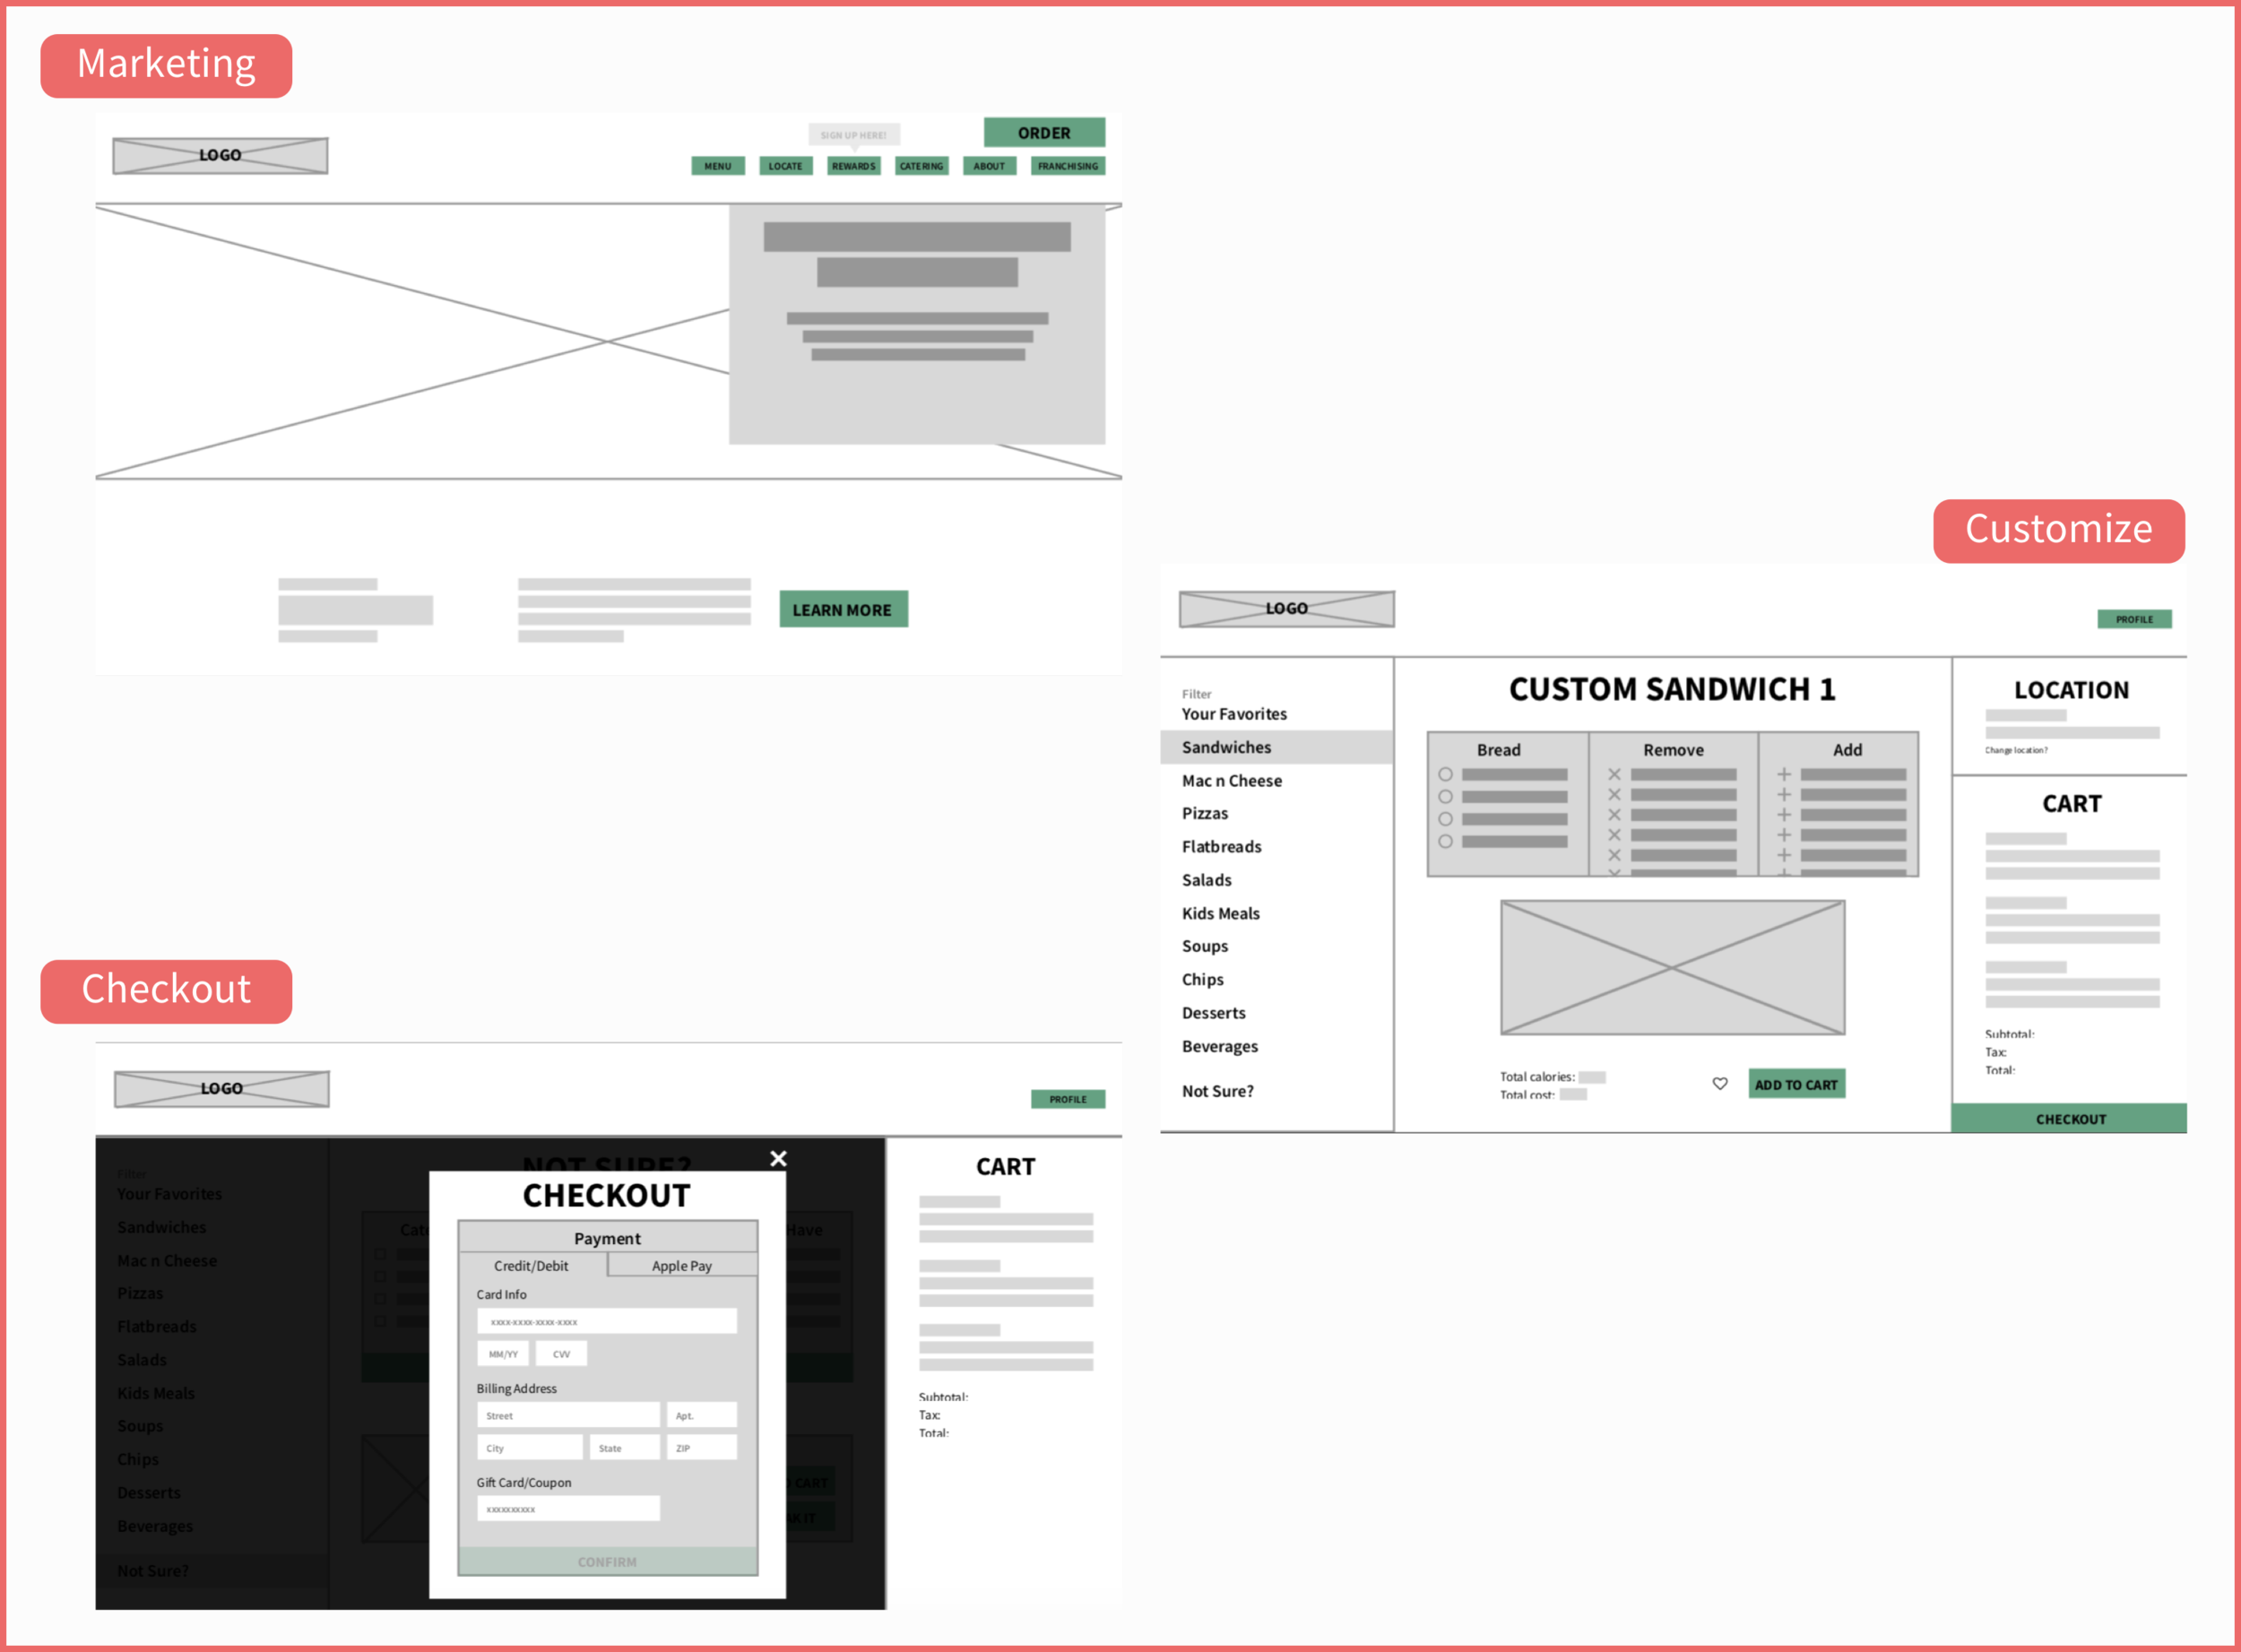
INITIAL DIRECTIONS
Each teammate went home and drew up different concepts, sections of the experience for the most part. Then we brought all of the sketches together, stitching them into 3 different, distinct directions: accessibility, consistency, customizability.
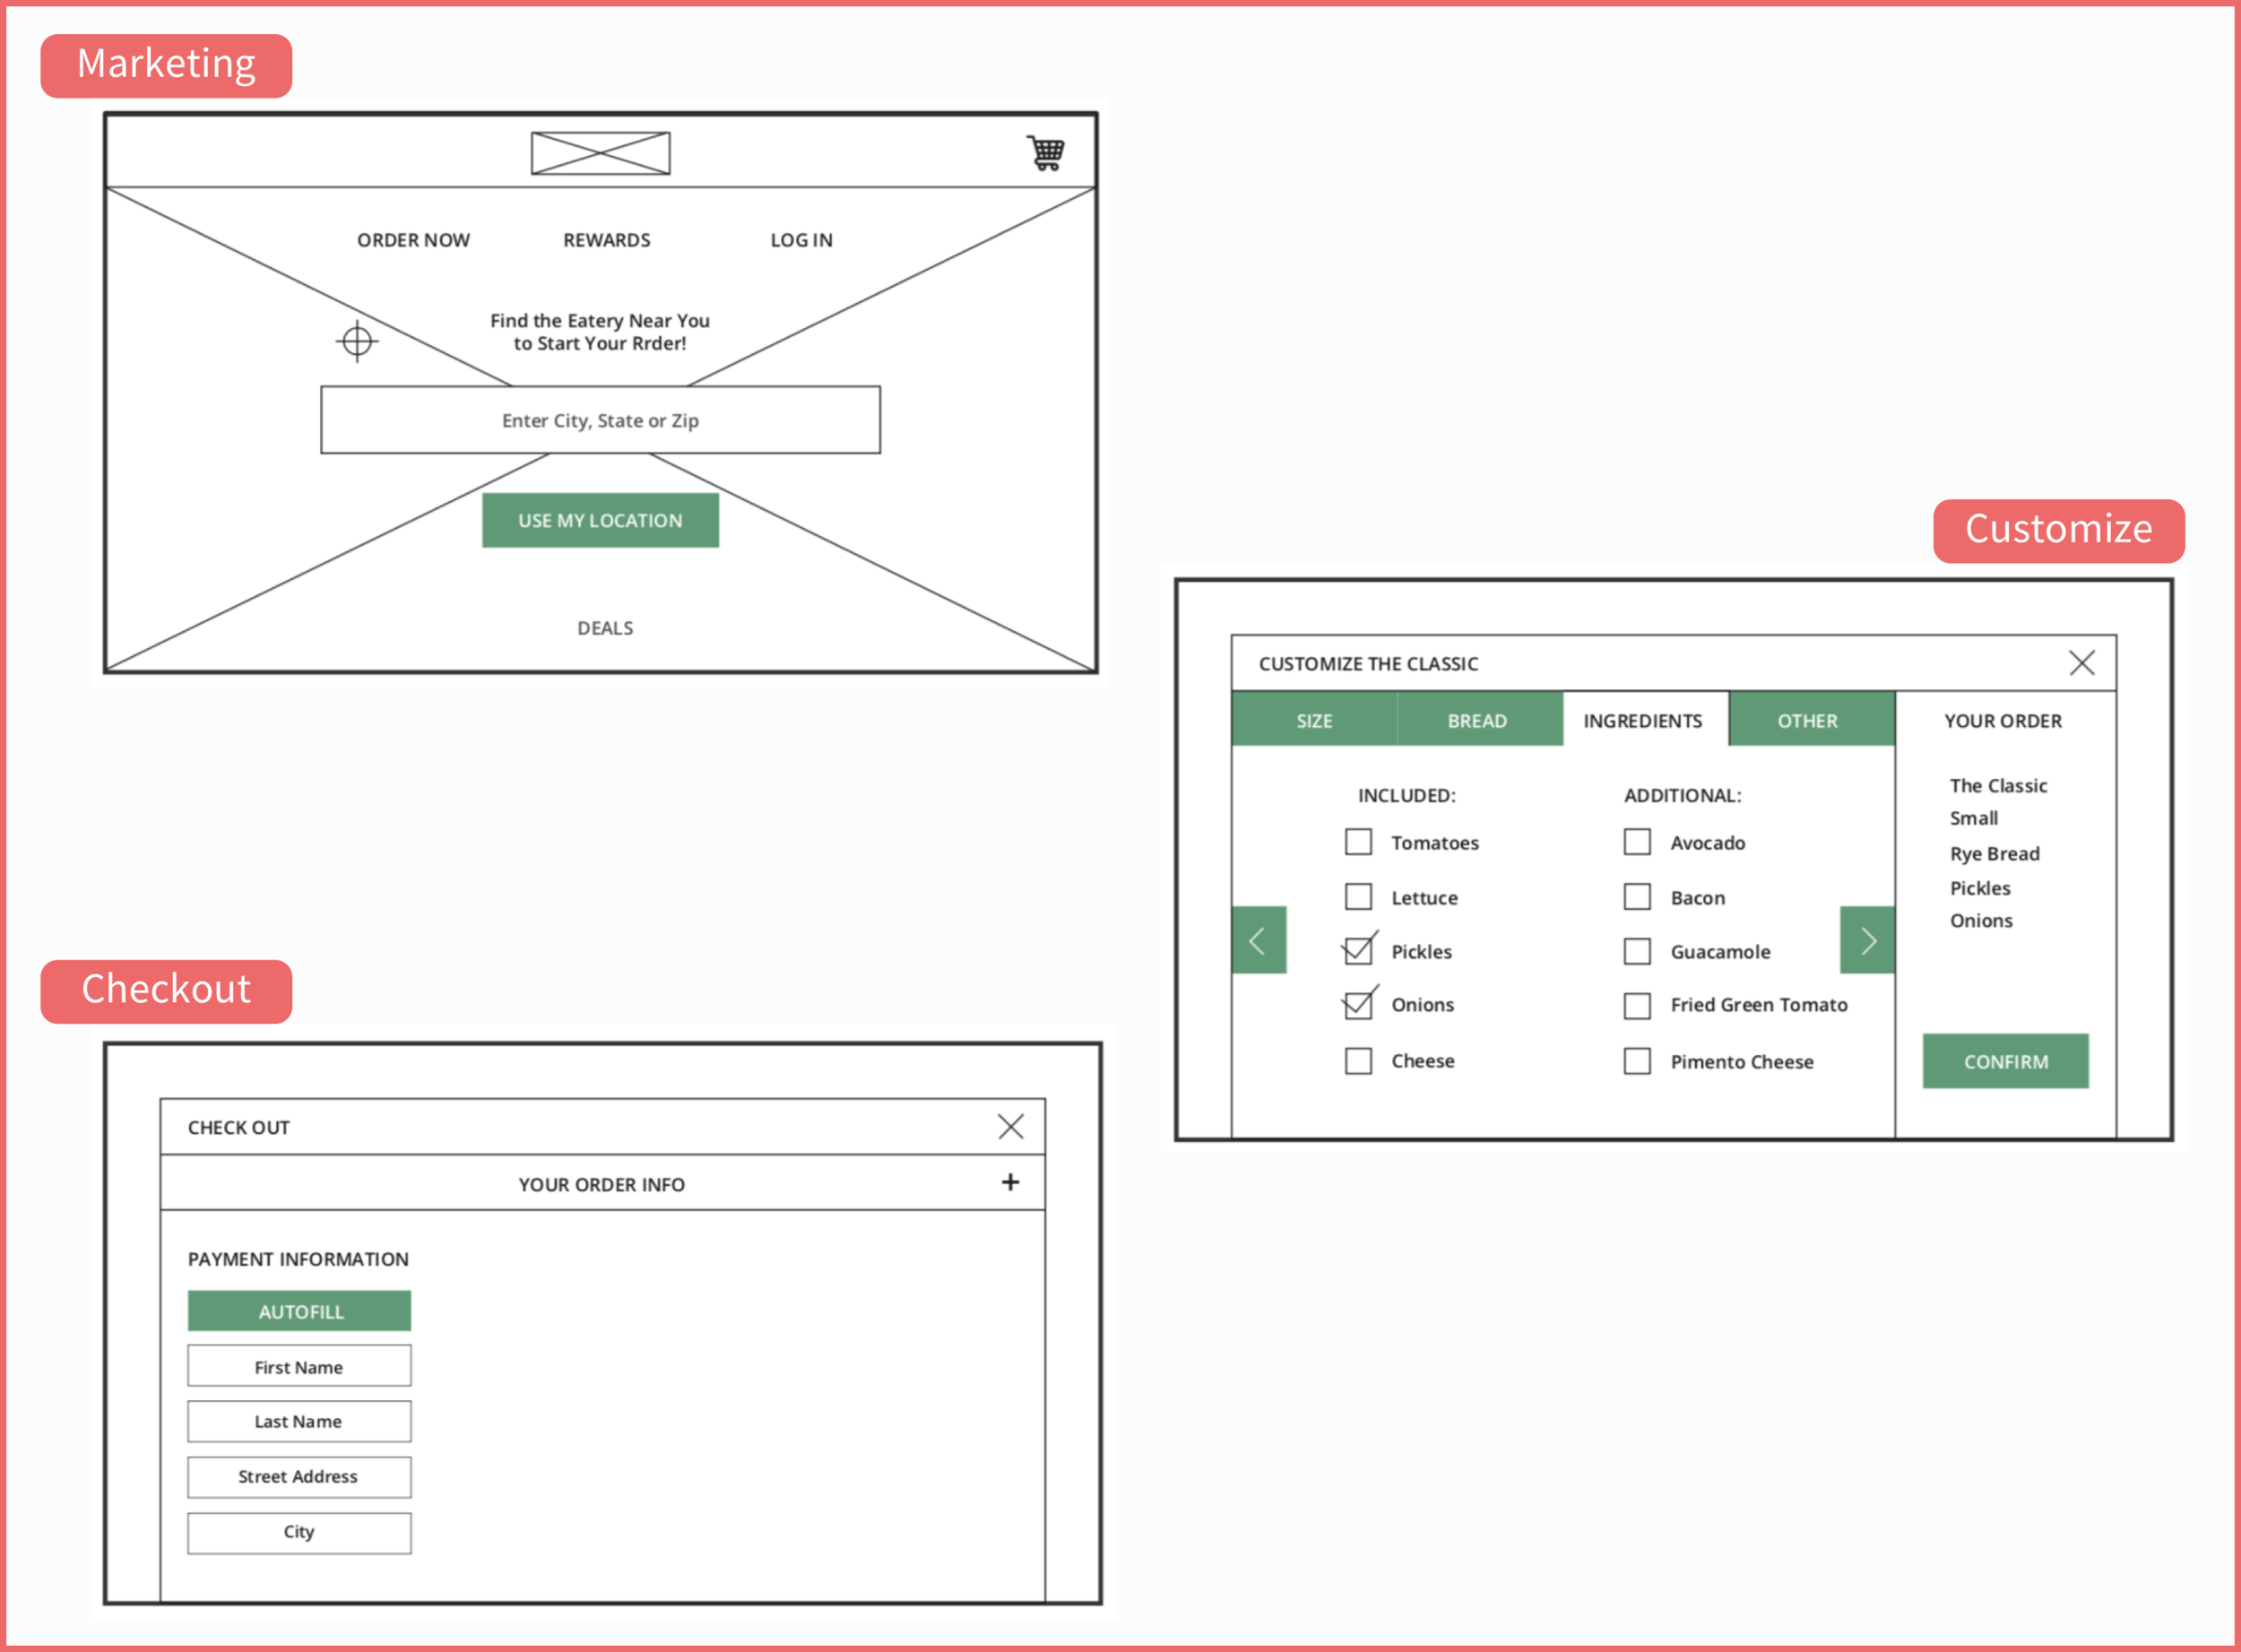
After generating these different, we quickly launched testing studies. Participants were to perform three tasks while thinking aloud: start an order, create one custom sandwich, and checkout. Our evaluation was based the notes written during the cognitive walkthrough and also virtually through Optimal Workshop’s chalk mark test. The key findings we found were insightful per each design:
Accessibility
Checkboxes on Customization flow were clear
Layout of Confirming order was lacking some clarity
Determined to be compatible for mobile devices
Consistency
Favored icons and cards for various menu options
Dropdowns for changing amount of customization food option is not favored
Display for pickup time “needs a new home”
Customization
Favoriting was a popular and expected feature
Wanted order information present at all times
Confused on editing items within Customization flow
FINAL DESIGN
Taking the best and leaving the worst, we combined all through design routes into a final design. We changed the user flow and made sure to carry out our key features.
New User Flow
KEY FEATURES
Consistent with marketing page
Limited navigation options
Cut down on tabs
Concise menu
Card layout
Synthesized customization process
Improved the checkout process
Offered more clean experience
Offered more payment options
Testing RESULTS
For more in-depth testing of our final design, we preformed A/B testing with the current design versus ours and we also performed heuristic analyses.
HEURISITIC ANALYSIS
We asked several people to go through an adapted heuristic analysis. In order to streamline the analysis, we added guidelines and cutdown on the categories. As a team, we also scoured the design with a very, very in-depth analysis. Definitely learned that while it is fantastic to rate every feature, every design choice made, it quickly becomes exhausting. Next time, I would break this down into smaller sections to be more digestible. Here’s a few distinguishing notes from the analysis results:
“The header on the home page and the order page change color significantly which makes it almost feel like a different website.”
“I would like a tracker to show me what’s going on with my order at all times.”
“I would like an apparent ‘back’ arrow to show me I can go back to add another item [when on the checkout page.]”
“Checkout is better done in bite sized pieces instead of asking for it all on one screen.”
A/B TESTING
For the A/B testing, 4 participants (1 who was fully blind) were asked to perform 3 tasks: customize a sandwich, create a favorite sandwich, and complete order. We tracked their time, number of input actions required, success rate, and asked a post reflection survey based on the NASA TLX to gauge their experience. We also recorded any comments they made during the process. These results exemplified the improvements the team made to the current design. Here are the results per each task:
Task 1: Customize a Sandwich
For non-sighted users:
Lowered mental demand by 38%
Lowered effort by 43%
Increased performance by 43%
For sighted users:
Reduced time taken by 81%
Reduced number of tabs needed by 6%
For all users:
Satisfaction increased by 19%
Task 2: Create a Favorite Sandwich
For non-sighted users:
Lowered mental demand by 69%
Lowered effort by 73%
Lowered frustration by 75%
For sighted users:
Reduced number of errors made to 0
For all users:
100% of users able to complete task
Task 3: Complete Order
For non-sighted users:
Lowered mental demand by 20%
Lowered effort by 14%
For sighted users:
Reduced time taken by 38%
Reduced number of tabs by at least 11%
NEXT STEPS
Of course no design ever really is finished, so if this project were to continue, this list would be priority:
Screen Reader Pathing needs to be thought out and mapped out more
Headers’ colors need to be consistent
Add back arrows so the user is able to undo actions at every step
Checkout payment options should be finalized (instead of showing “Other”) and can include options like PayPal and
“Pay At Counter”Change description and action layout of menu items to reduce clutter and to better accommodate screen readers
Actions and Text layout for each order item in Cart should be grouped and spaced so most important information is clear to user